| Math/Lectura |
As students complete the ISIP, campus and district managers can see monthly percentages of who has taken the assessment using the Assessment Completion Report or Assessment dashboard.
Assessment Completion is available only to users who have manager-level accounts at the school or district level.
The blue area on the graph shows the percentage of students assessed out of the total enrolled, with the total enrolled indicated by the gray area.
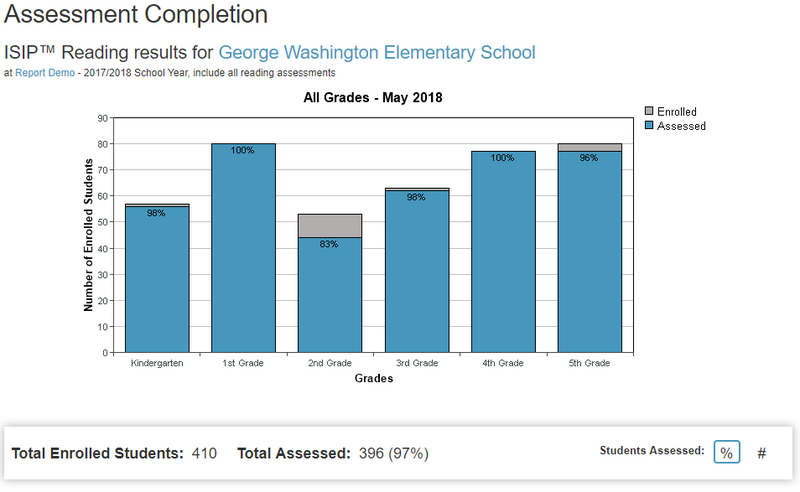
The "%" and "#" icons can be used to toggle the chart at the bottom of the screen.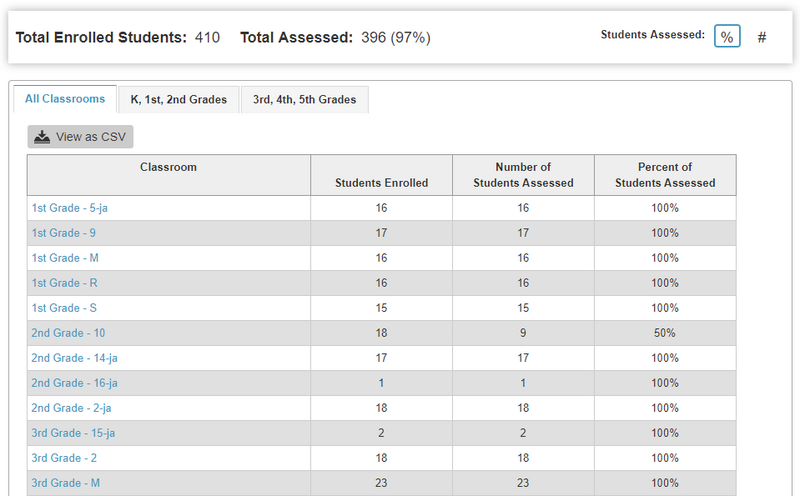
Report Details
Who is listed on this report?
At the campus level, classrooms are listed in alphabetical order. Clicking on a classroom will provide student information.
At the district level, campuses are listed in alphabetical order. Clicking on a campus will allow you to drill down to classroom and student information.
How to navigate this report?
At the district level, administrators will see campus-wide assessment completion percentages for that specific assessment period. From here, they can click on a specific campus to see classroom-level assessment completion percentages.
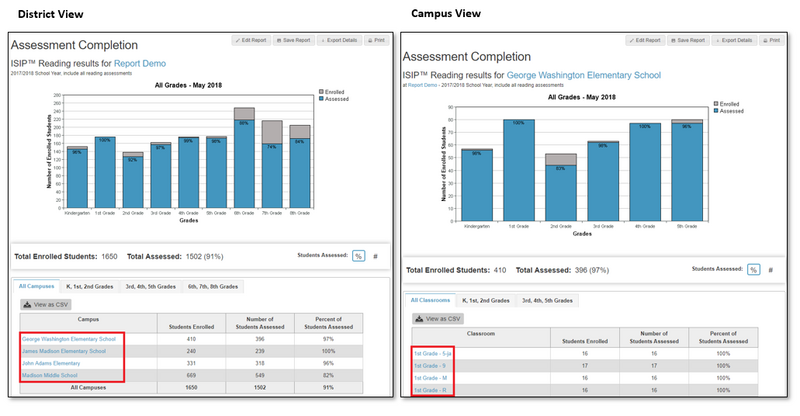
Clicking a classroom will take you to its Classroom Information Page.
How can I run this report?
Assessment Dashboard (Campus View)
Step 1: Log in to Amira and click Math.
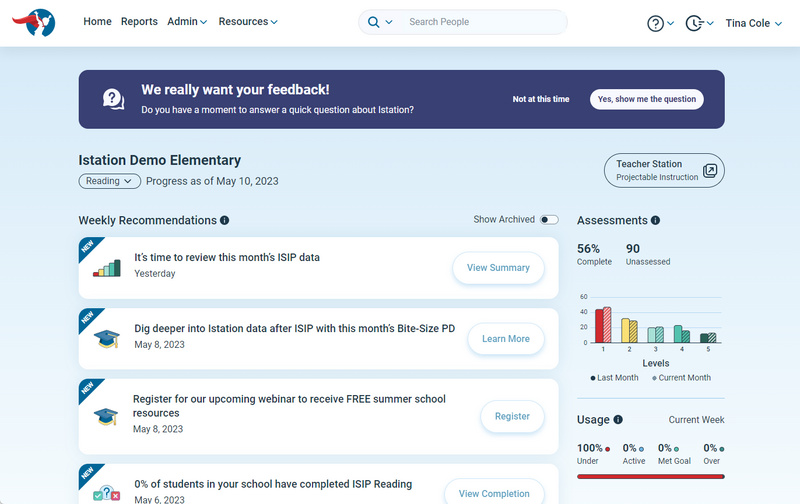
Step 2: View the assessment completion percentage rate for your campus.
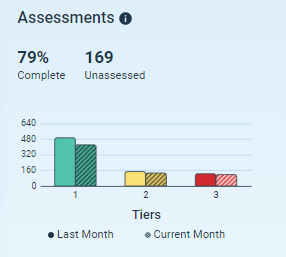
Step 3: Click on the dashboard to open the Assessments slideout section.
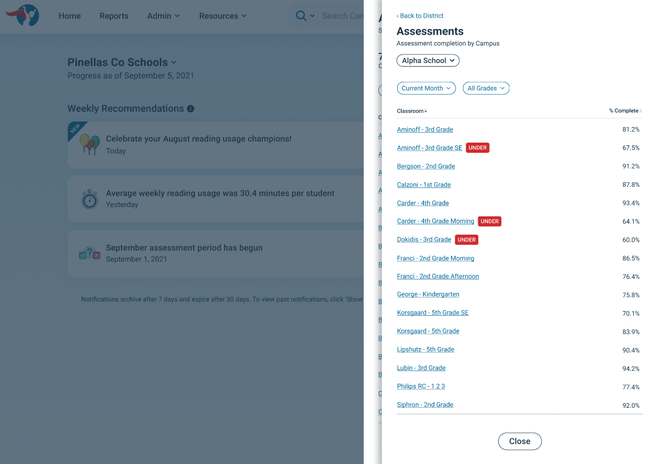
Campus/Admin Tab
Step 1: Log in to secure.app.amiralearning.com.
Step 2: Select the Campus or Administration tab.
Step 3: Scroll down and click Assessment Completion for Reading or Math in the left panel under Related Reports.
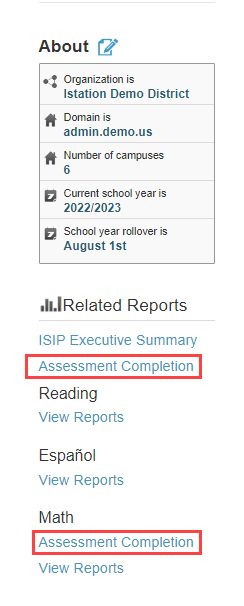
Step 4: Click Edit Report to show only Reading or Lectura.
Step 5: Uncheck the box for All Reading Assessments.
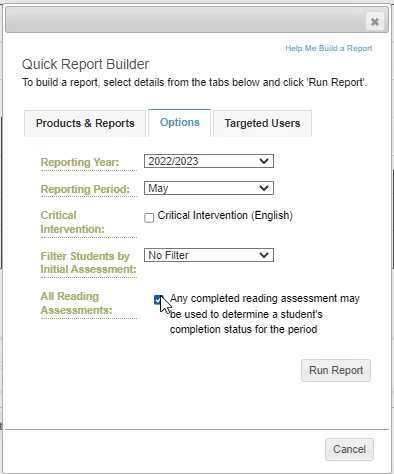
Step 6: Click the Products and Reports tab and select the appropriate assessment completion report.
Report Tab
Step 1: Log in to secure.app.amiralearning.com.
Step 2: Select the Report tab.
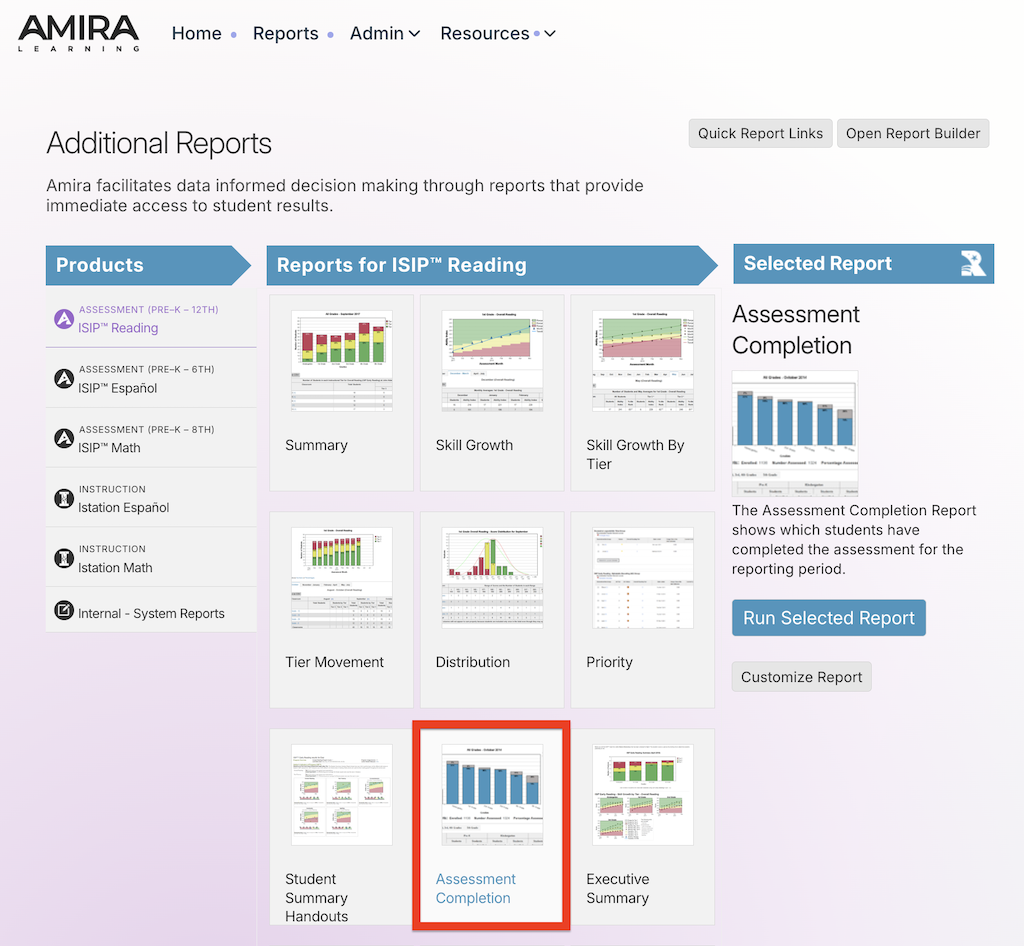
Step 3: Under Products, select Reading, Math, or Lectura.
Step 4: Under Reports, select Assessment Completion.
Step 5: Click Customize Report to show only Reading or Lectura assessment data by unchecking the box for All Reading Assessments.
Step 6: Click the Products and Reports tab and select the appropriate assessment completion report.
Step 7: Click Run Report.
Suggested Instructional Uses
Review monthly or after the most recent assessment until satisfied with the completion percentage.