| Math/Lectura |
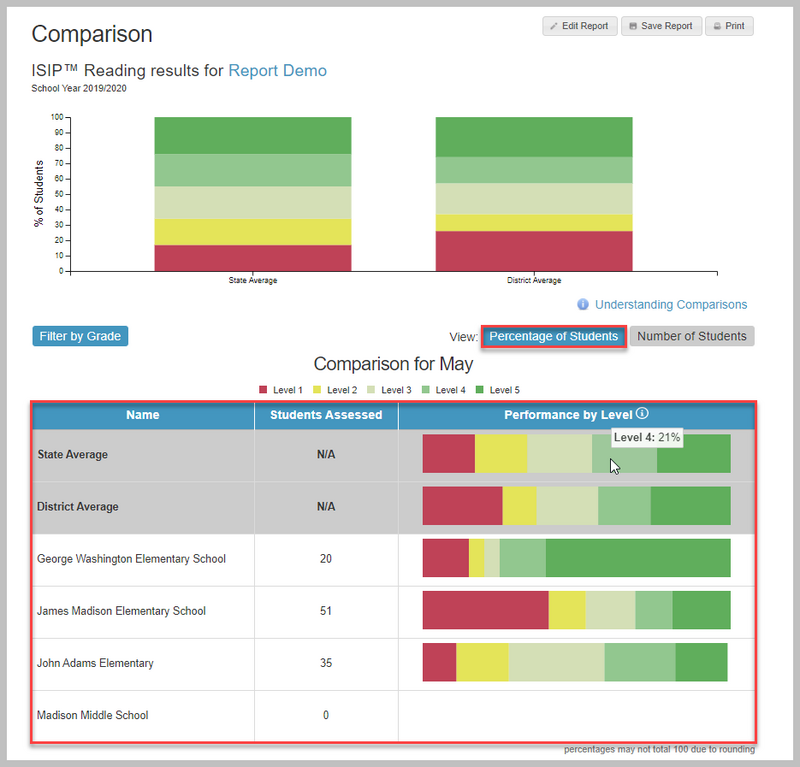
The Comparison Report provides state and district averages from the most recently completed assessment.
This report can be used to gain a high-level understanding of your students’ assessment performance compared to the average performance of their district and/or state peers by providing the count (and percentage) of students per instructional grouping. Grade filters are available to allow for comparison among specific grades or groups of grades. This report covers all products.
Please note that when viewing a calculated average of students per instructional grouping (e.g. the State Average row on the data grid), the number of students assessed is based on the sum of students per instructional grouping, not merely an average of the percentage at all schools.
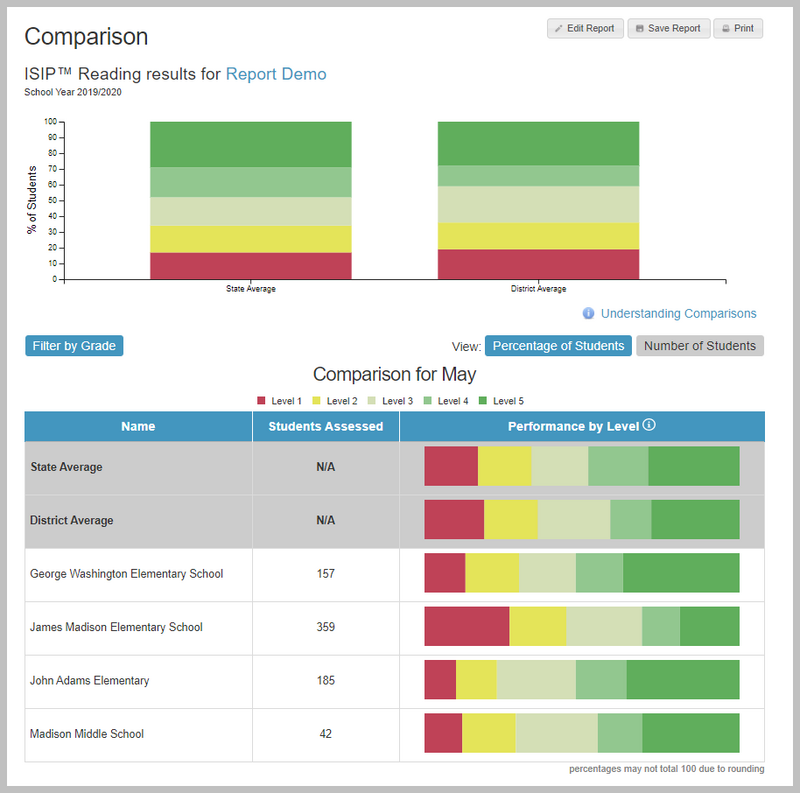
District View
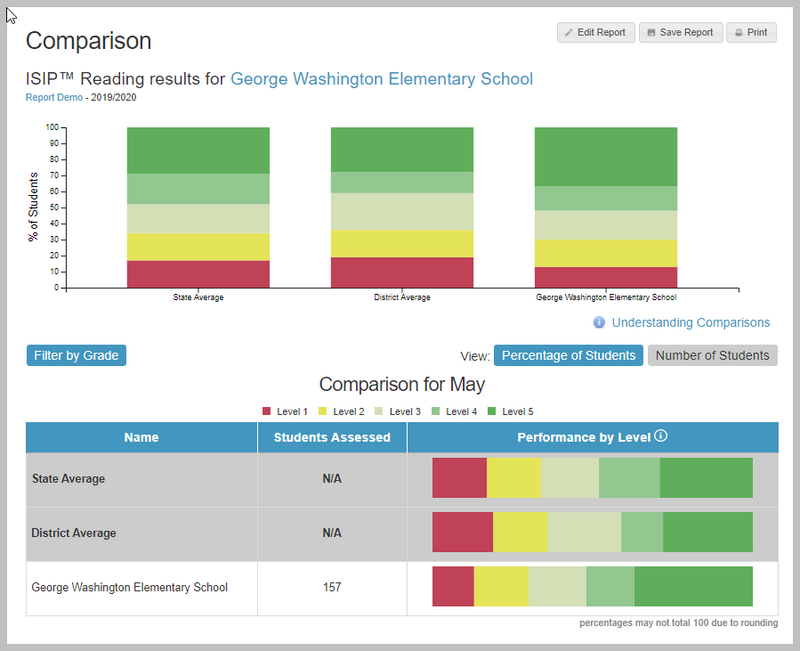
Campus View
Report Details
Who is listed on this report?
At the campus level, data is given about the total number of students assessed at the campus and how many students are in each tier/level.
At the district level, data is given about the total number of students assessed at each campus in the district and how many students are in each tier/level at each campus.
At each level, percentages are given to represent state and district averages for each tier/level.
How to navigate this report?
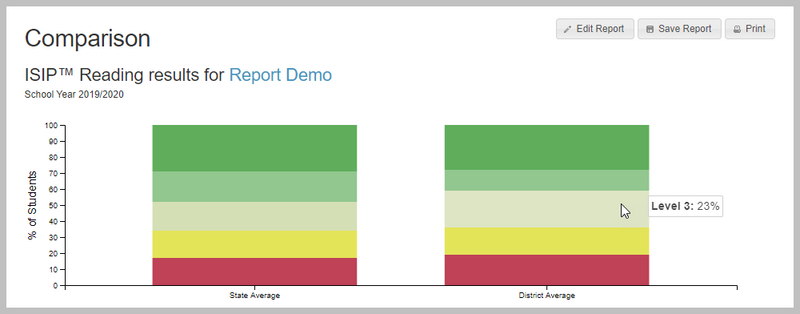
Hover over a specific level/tier to view the percentage of students within that given performance scale at the state or district level.
Filter by Grade to compare state, district, and campus results by a specific grade level.
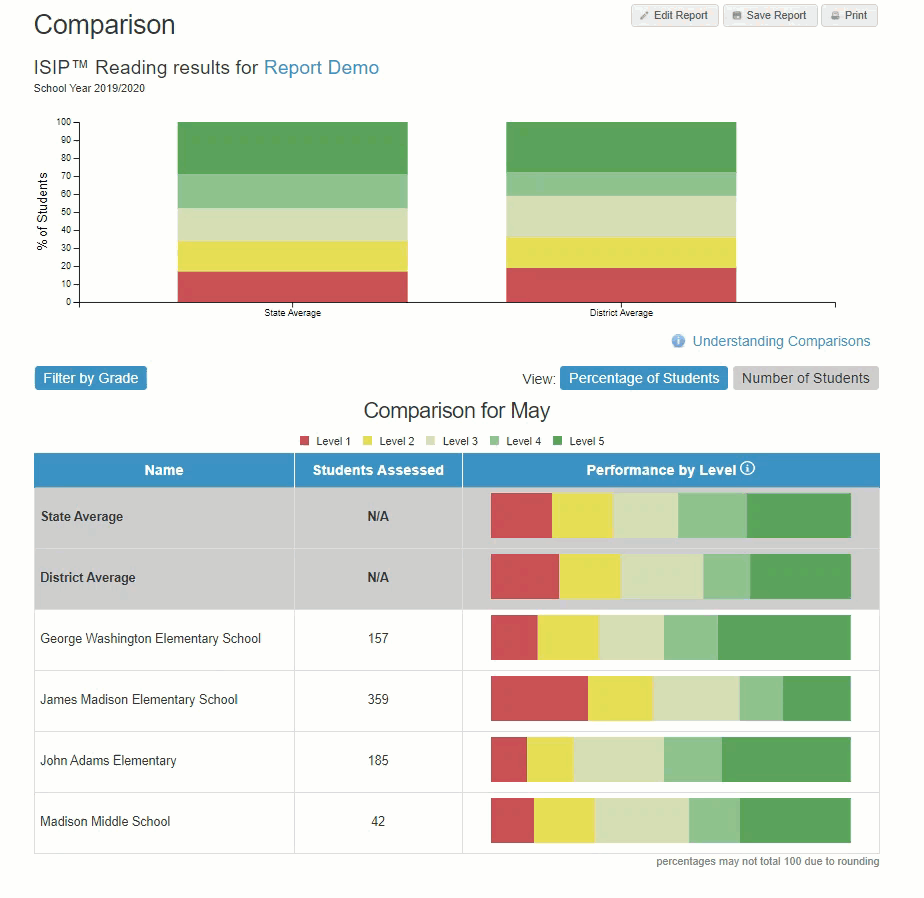
Toggle between Percentage of Students and Number of Students to change the View between the colored ratio bar and student totals/percentages.
How can I run this report?
Step 1: Log in to secure.app.amiralearning.com.
Step 2: Select the Report tab.
Step 3: Select an Assessment product.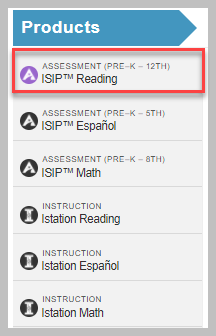
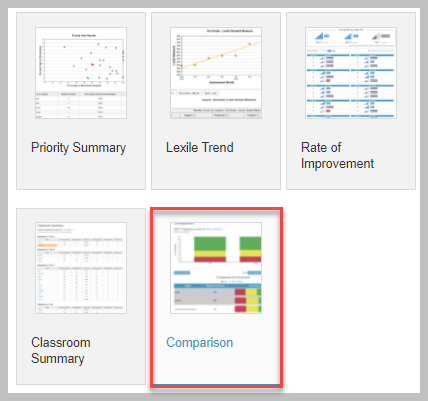
Step 4: Select Comparison from the choices.
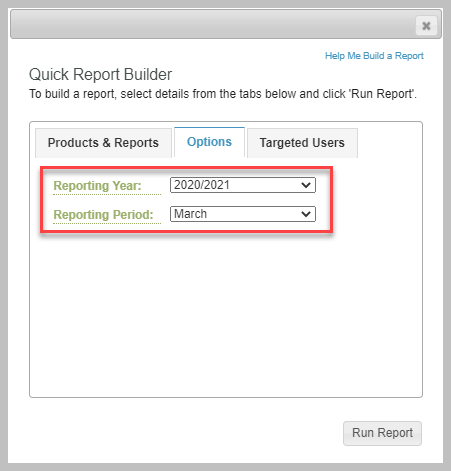
Step 5: Click Run Selected Report or Customize Report. Customizing the report provides options to change the Reporting Year and Reporting Period.
Suggested Instructional Uses
- Campus managers can compare data with the district and state averages to help create classroom goals and intervention plans with teachers
- District managers can compare campus data to district and state averages to help create campus goals and intervention plans with campus administrators