| Math/Lectura |
The Executive Summary provides a brief overview of district or campus-wide overall assessment data for a reporting period.
Campus and district managers can run this report to view campus or district-wide Summary and Skill Growth by Tier/Level reports for all products for which the campus/district has a subscription. The top of the report shows Summary reports, and the bottom shows skill growth by tier/level reports. We recommend you review this report monthly or after the most recent assessment as well as run this report for BOY, MOY, and EOY periods to analyze school-year trends. It can help determine strengths and weaknesses to help plan intervention.
Example Report - Tiers
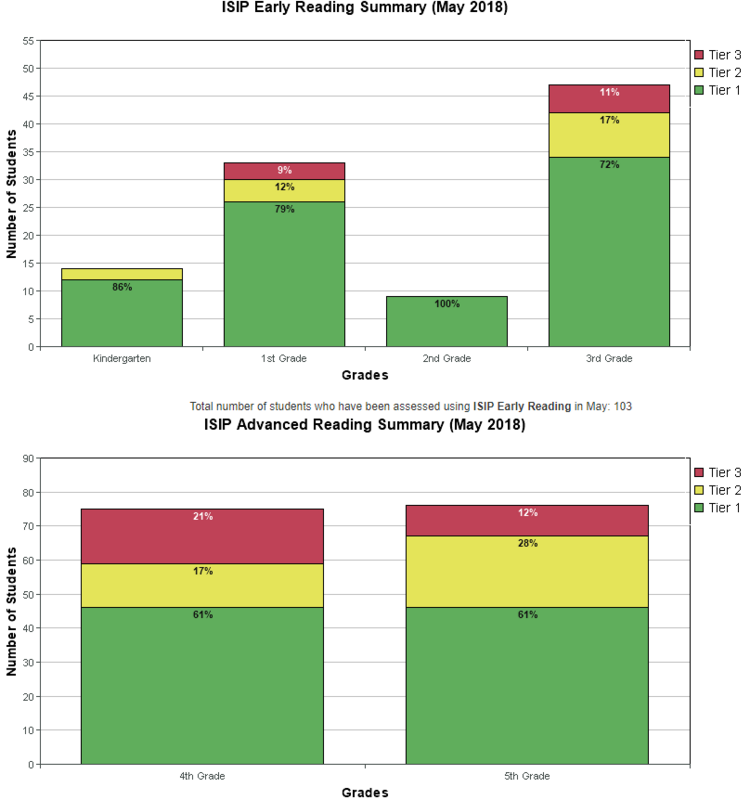
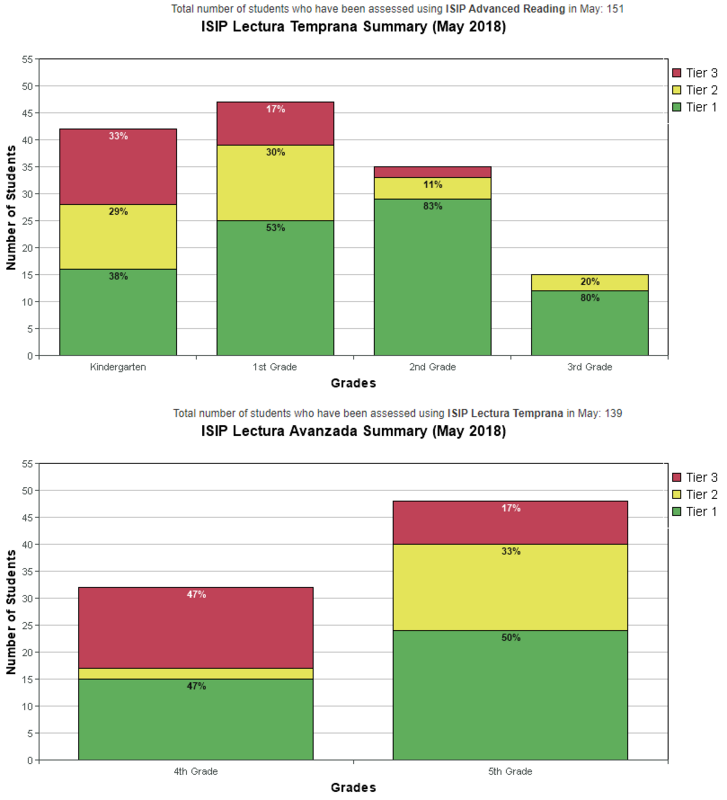
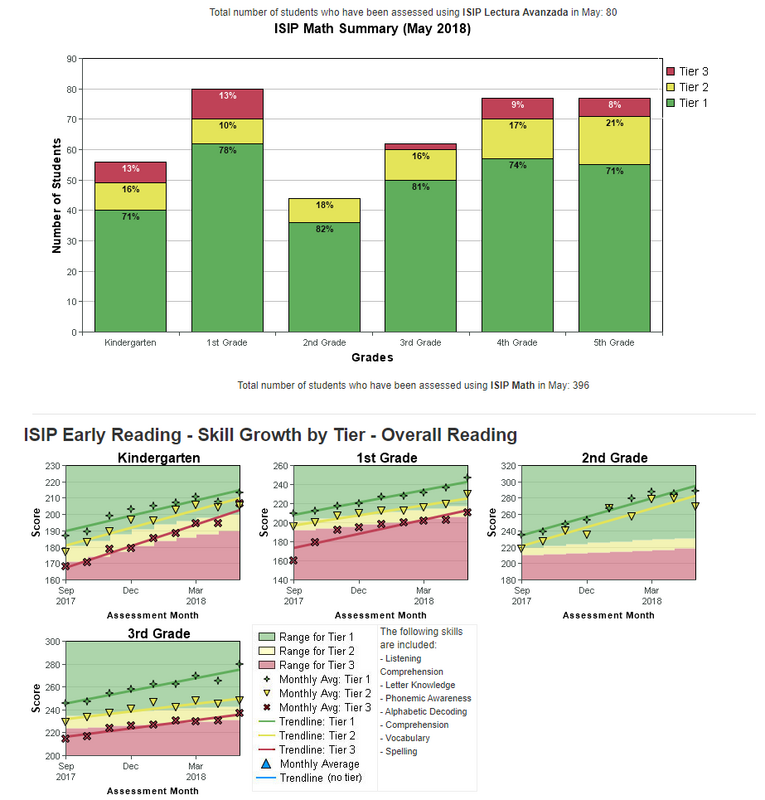 The values plotted on the Skill Growth graphs show the average student performance for the group of students identified.
Example Report - Levels
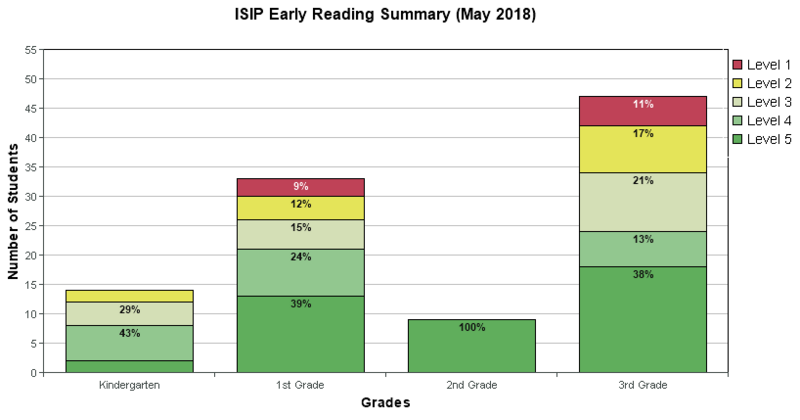
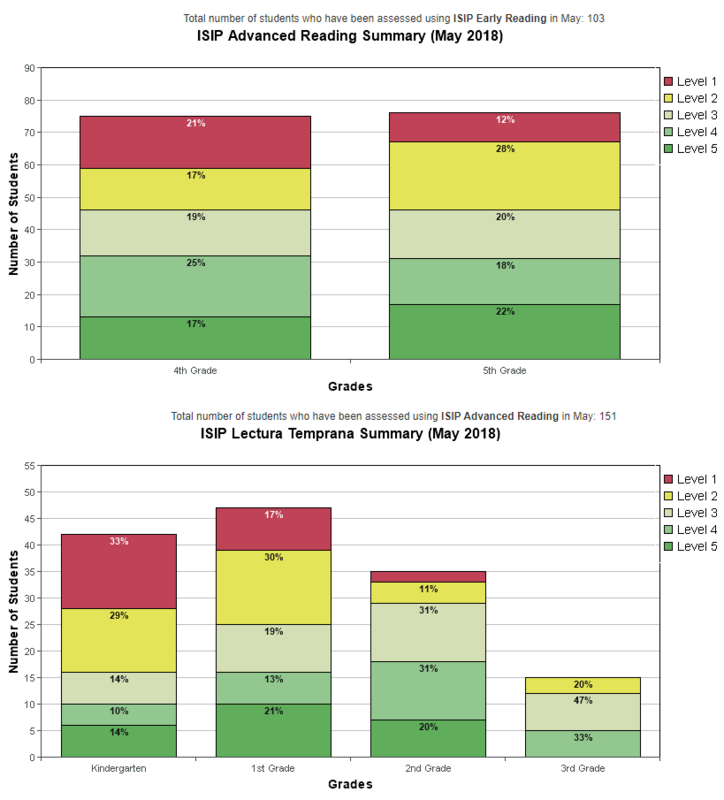
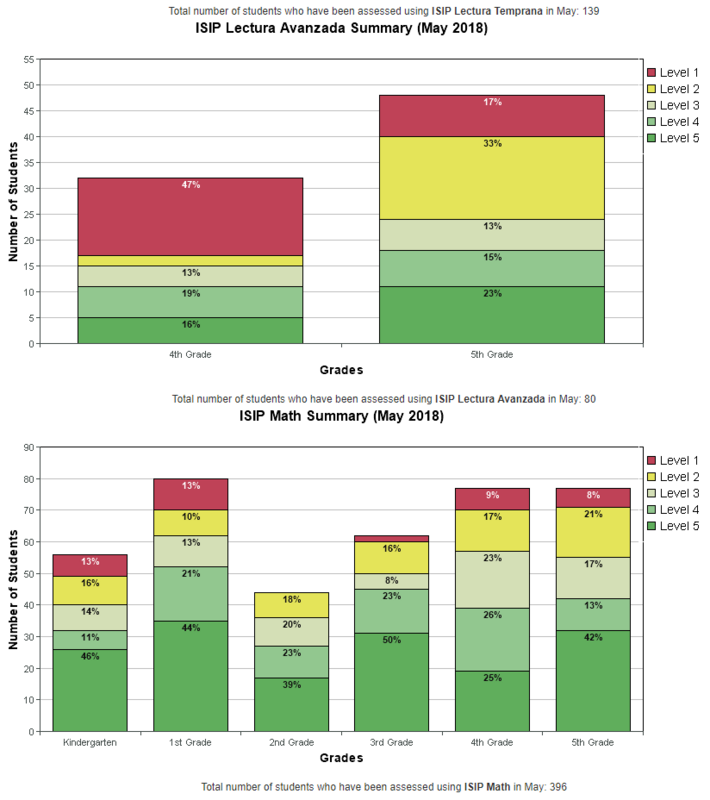
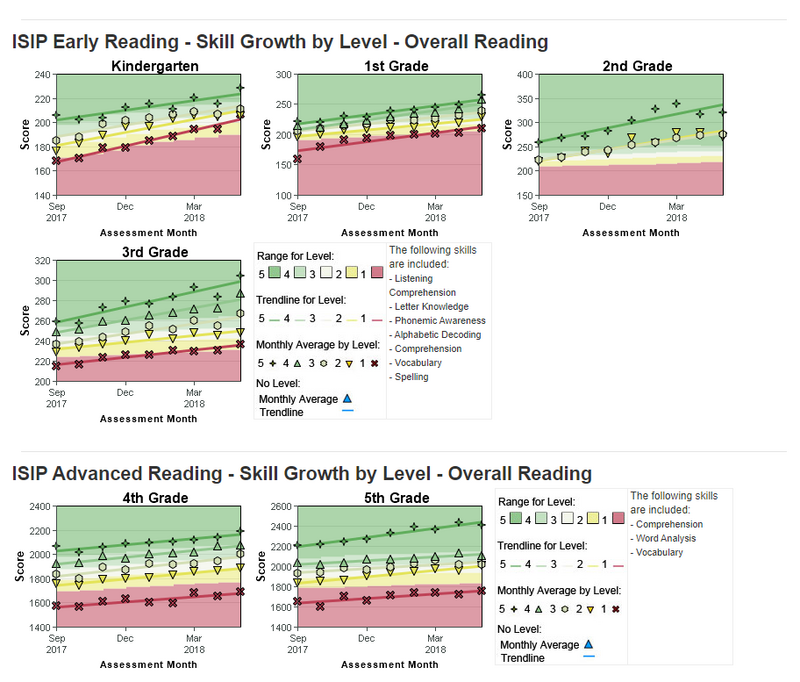 The values plotted on the Skill Growth graphs show the average student performance for the group of students identified.
Step-by-Step Guides to Run Report
Administration Page
Step 1: Log in to secure.amiralearning.com.Step 2: Click the Admin tab and select Administration or Campus.Step 3: Select Executive Summary under the Related Reports section at the bottom left of the page.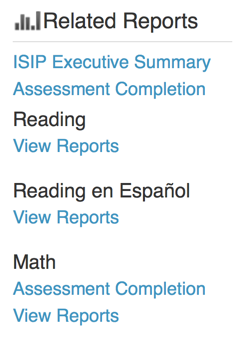
Report Tab
Step 1: Log in to secure.amiralearning.com.Step 2: Select the Report tab.Step 3: Select an Assessment product.Step 4: Select Executive Summary from the choices.Step 5: Click Run Selected Report.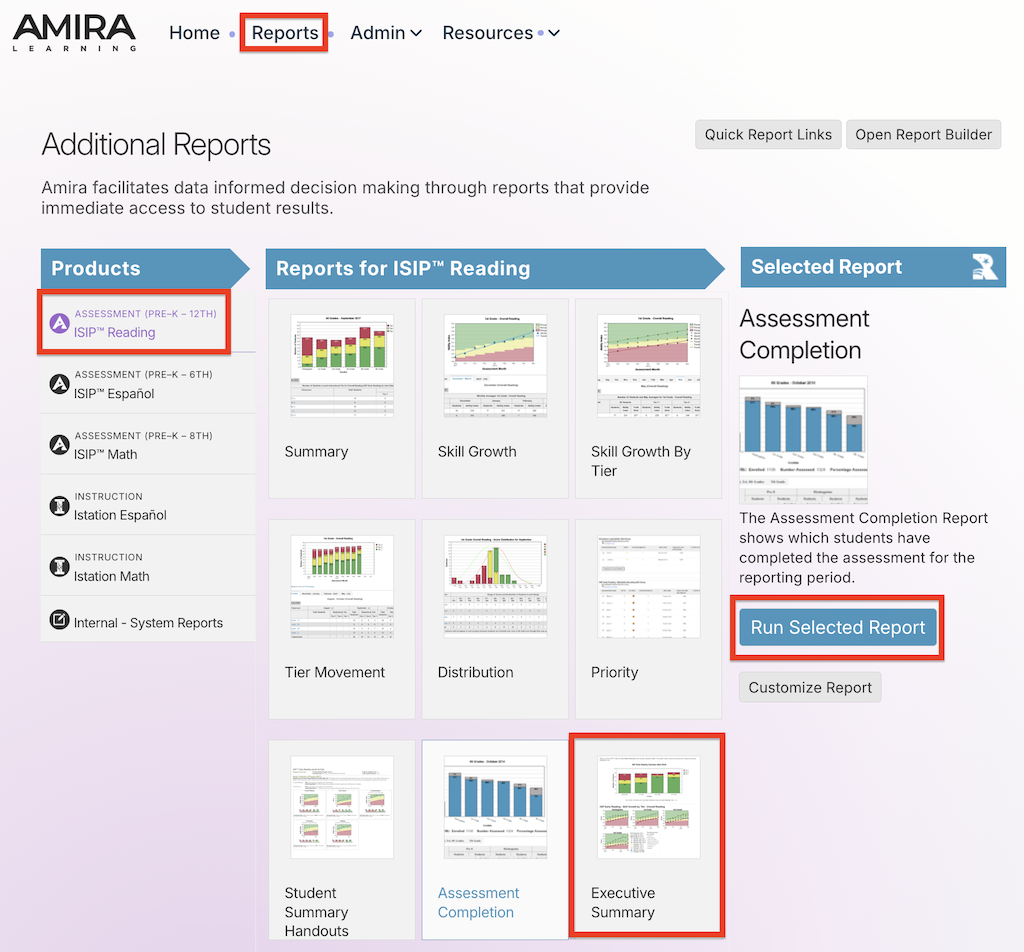
Report Details
Who is listed on this report?
At the campus level, campus-wide student data aggregated by grade level is included.
At the district level, district-wide student data aggregated by grade level is included.
Student information is not specified in this report. To view individual student data, click Export Details.
How to navigate this report?
Administrators will see a snapshot of data for that specific assessment period. From here, they can click on a subject's grade level bar or line graph to see grade-level performance details. For example, clicking on the 1st-grade bar of the Early Reading Summary graph will take you to the full Summary report of the specified reporting period for 1st grade. Clicking on the 1st-grade Skill Growth by Tier/Level graph will take you to the full ISIP Skill Growth by Tier/Level report for 1st grade.