|
Legacy Reading & Lectura |
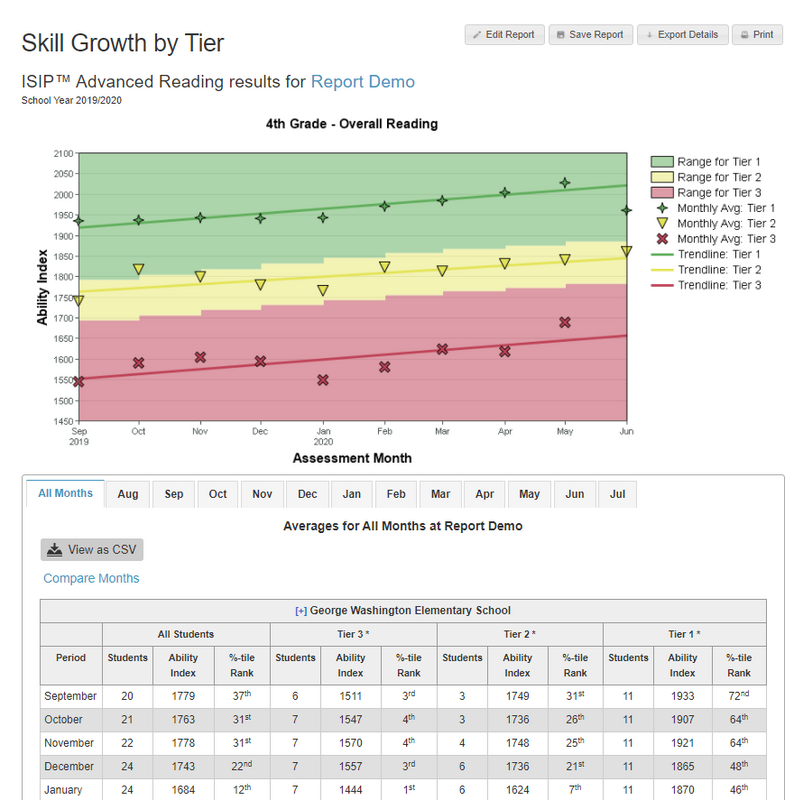
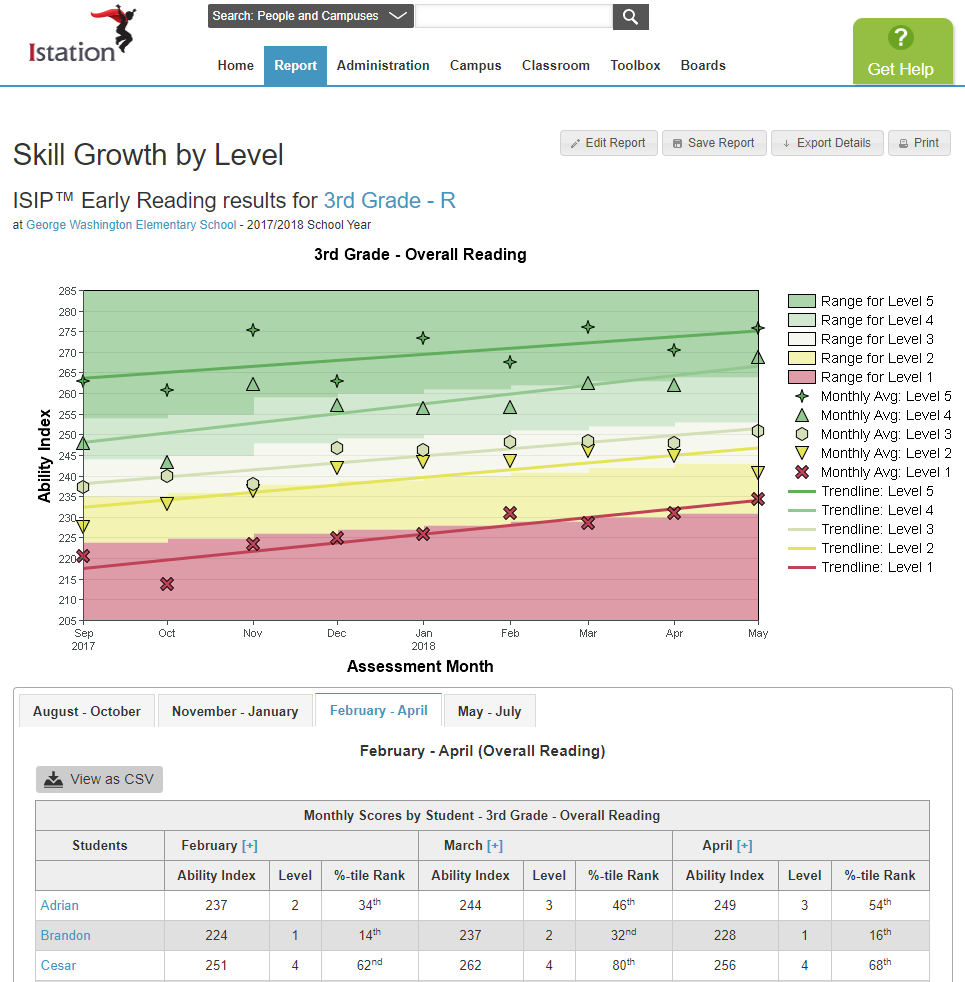
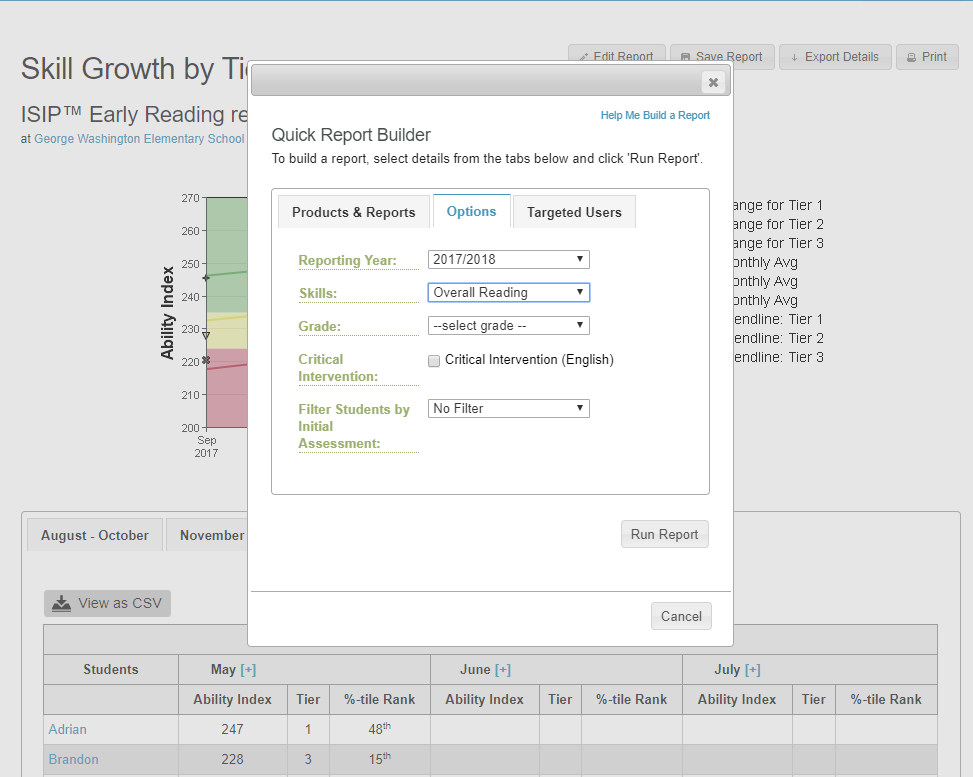
Skill Growth by Tier/Level shows each skill assessed and the progress made by students through the current month as measured against performance goals within tier/level groups.
Each line represents the growth of students grouped by instructional tier/level, as determined by the beginning-of-the-year assessments.
The ability index for each student is presented in the table below the graph.
Students are placed in tier/level groups based on their initial assessment and remain in that group all year, even when their scores move out of their initial tier/level.
Tiers
Levels
Report Details
Who is listed on this report?
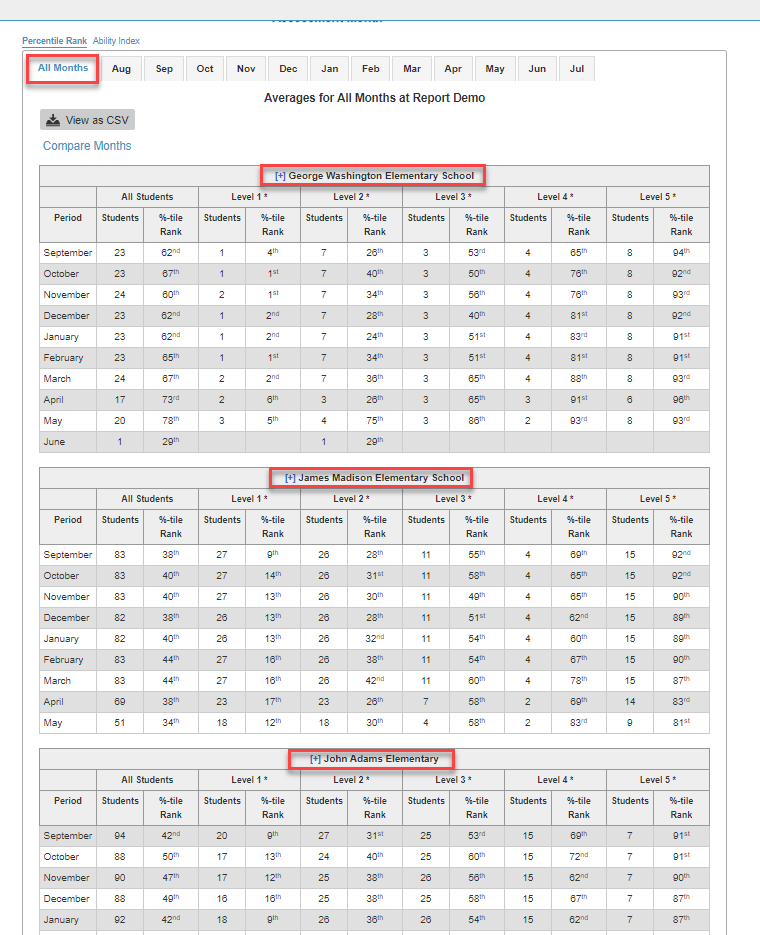
At the classroom level, students are listed on the report in alphabetical order according to their last name.
At the campus level, classrooms are listed in alphabetical order. Clicking on a classroom will provide student information.
At the district level, campuses are listed in alphabetical order. Clicking on a campus will allow you to drill down to classroom and student information.
How can I navigate this report?
The graph will show educators the school-year growth trendlines for each level/tier of the specified grade level, with data points representing monthly averages. Clicking a specific campus from the table takes district administrators to the campus-level report, and clicking a specific classroom takes administrators to the classroom-level report.
Administrators can track monthly growth for each grade level at the campus/classroom level by selecting the All Months tab below the graph. This table shows the number of students within each instructional level/tier for each month assessed, along with the average ability index (score) and percentile rank.
At the classroom level, teachers can view individual student results in the table.
At any level, hovering over a data point shows the average ISIP score and the number of students who scored at that level/tier for the data point's month. Clicking on a data point generates the ISIP Summary report for that data point's reporting period.
How can I run this report?
Step 1: Log in to secure.app.amiralearning.com.
Step 2: Select the Report tab.

Step 3: Select an Assessment product.
Step 4: Select Skill Growth By Level from the choices.
Step 5: Single-grade classroom teachers may click Run Report. Administrators and multi-grade teachers must click Customize Report.
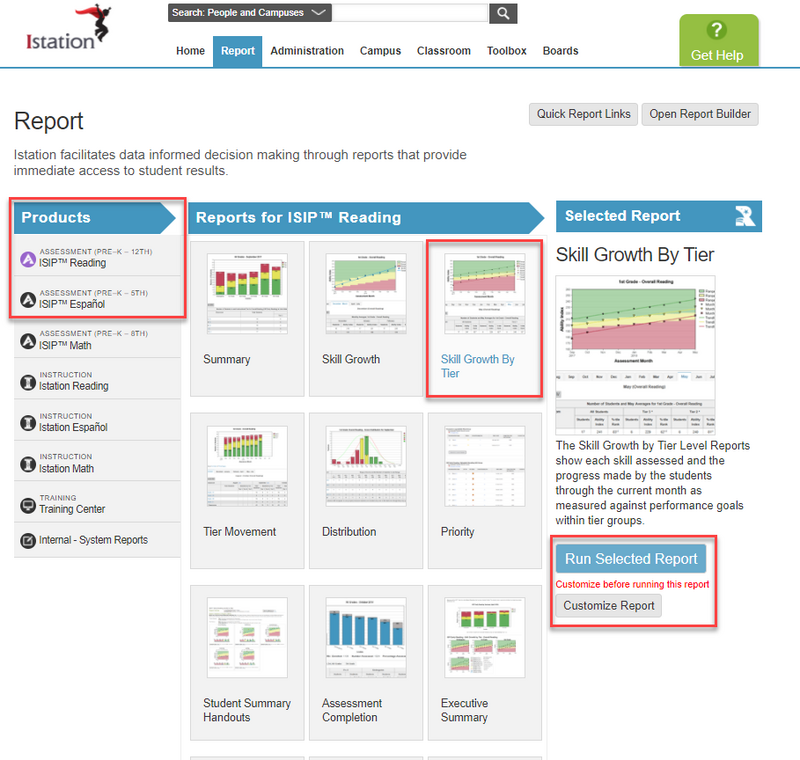
Step 6: Set the grade level from the drop-down menu.
Step 7: Click Run Report.
Suggested Instructional Uses
-
Review monthly or after the most recent assessment.
-
Monitor the class’s tier/level movement by skill and overall reading ability.
-
Identify the level of student support needed.
-
Evaluate the effectiveness of instructional support.