The Distribution Report provides the number of students in a grade level who are performing in different ranges of ability scores from the most recently completed assessment.
This report displays students' ability scores, instructional tiers/levels, and percentile ranks in a distribution graph and table. Educators must specify a grade level to run this report at the campus or district level.
District
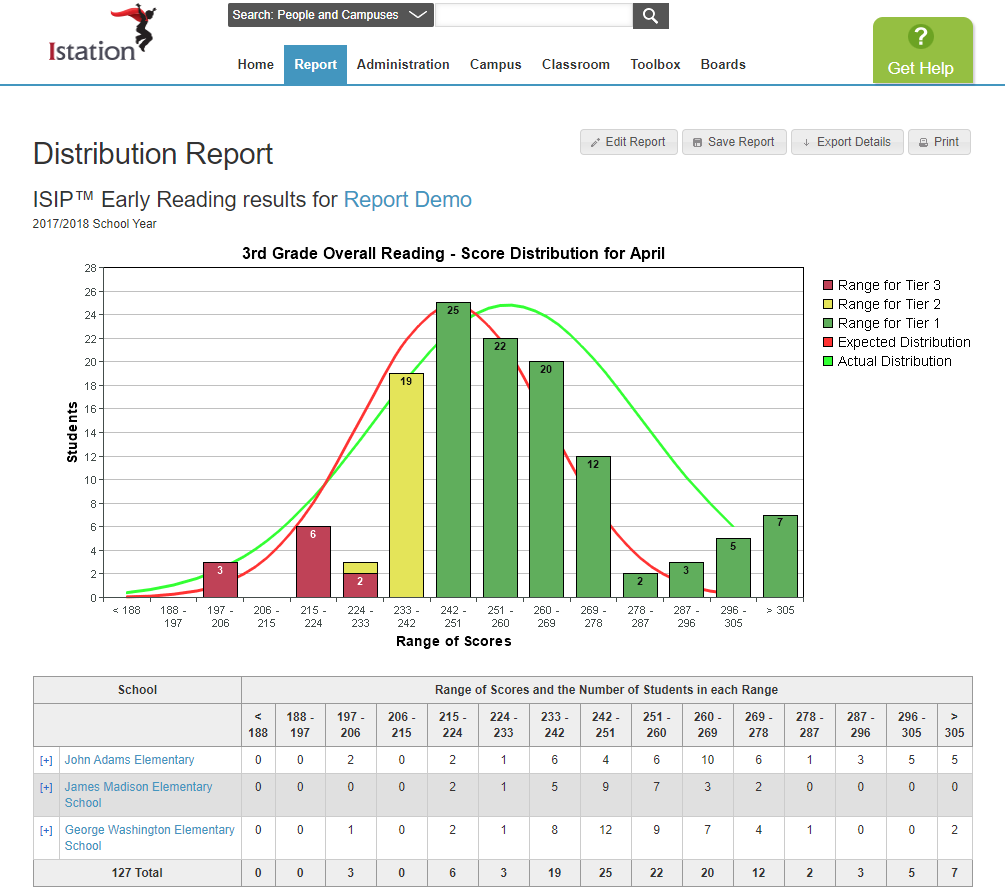
Campus
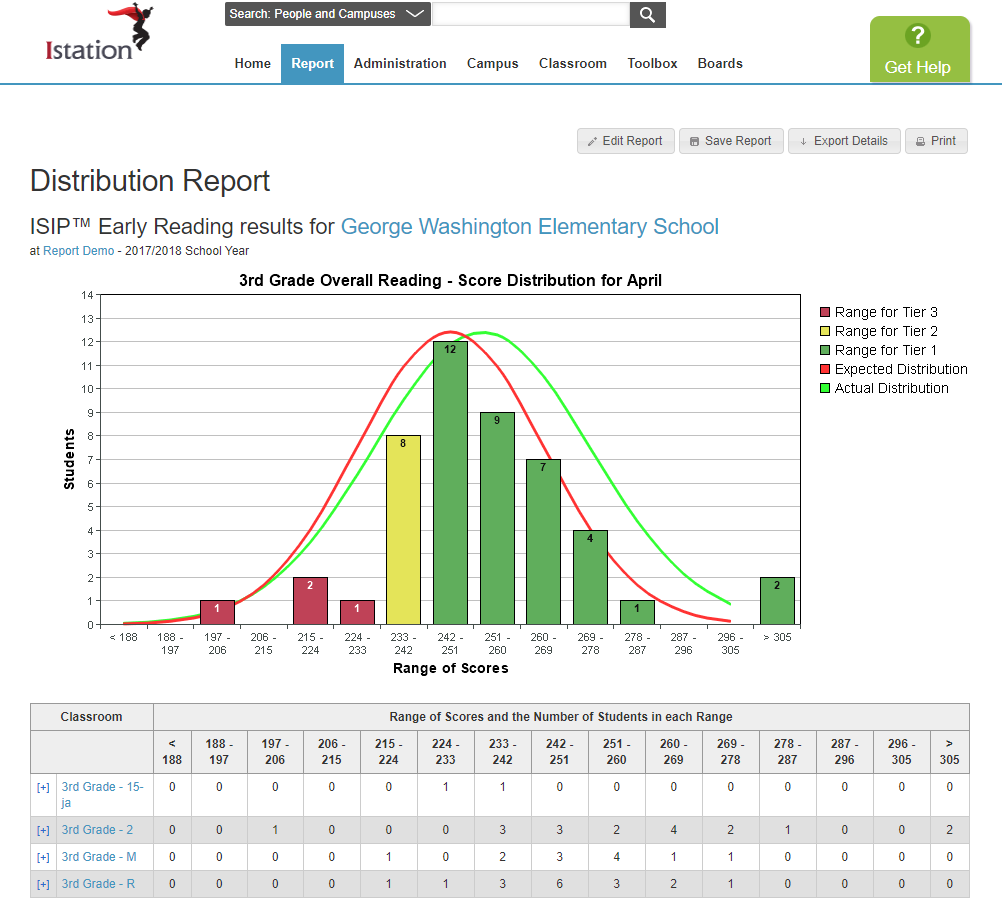
Classroom
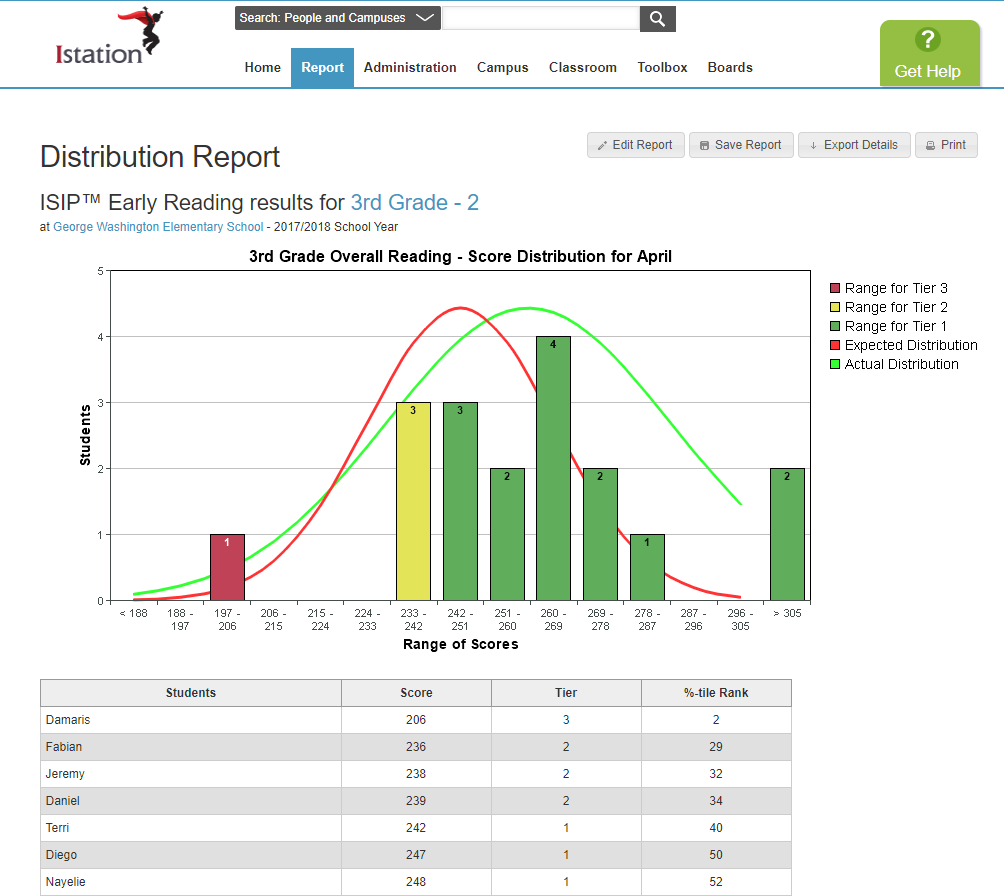
Report Details
Who is listed on this report?
At the classroom level, students are listed on the report according to their overall score from lowest to highest. Students without a score for the specified month are not included.
At the campus level, classrooms are listed in alphabetical order. Clicking on a classroom will provide student information.
At the district level, campuses are listed in alphabetical order. Clicking on a campus will allow you to drill down to classroom and student information.
How to navigate this report?
At the district level, administrators see ranges of scores based on the expected distribution. In the distribution graph, they see the number of students in each range district-wide, labeled by tier/level as well. In the table, they see the number of students in each range per campus.
At the campus level, administrators see ranges of scores based on the expected distribution. In the distribution graph, they see the number of students in each range campus-wide, labeled by tier/level as well. In the table, they see the number of students in each range per classroom.
At the classroom level, educators see ranges of scores based on the expected distribution. In the distribution graph, they see the number of students in each range classroom-wide, labeled by tier/level as well. In the table, they see their students' scores, levels, and percentile ranks organized from lowest to highest performance.
At each level, the expected distribution curve is in red and the actual distribution (based on the report's data) is in green.
How can I run this report?
Step 1: Log in to your account. Select Math.
Step 2: Select the Reports tab.
Step 3: Click on one of the Assessment Products, choose Distribution from the options, and click Customize Report.
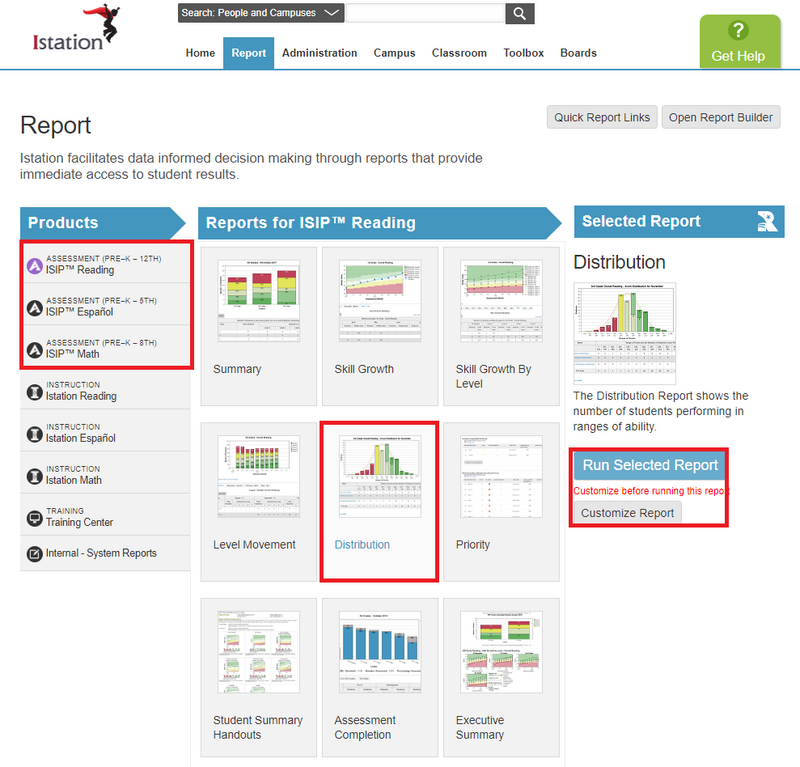
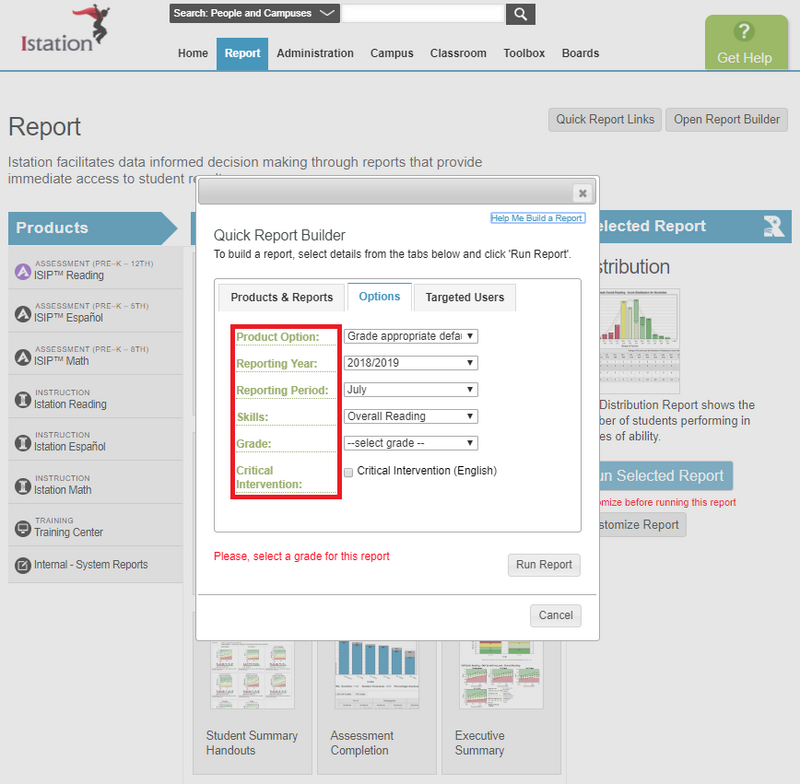
Step 4: Select an option from the Grade dropdown menu and click Run Report.
Suggested Instructional Uses
- Review monthly or after the most recent assessment
- Identify students in need of additional support.
- Group students for targeted instruction.
- Exporting this report will provide a breakdown of each subtest and tier/level.
- Save the report for BOY, MOY, and EOY for distribution comparison.